How to lose $1.5 million dollars in 13 years.
Many predictions suggested 2023 was going to be a year of declining real estate prices.Some said we would reach the bottom in the Spring of 2023 and some said the end of 2023.
Looking at the current numbers it appears we did reach 'a' bottom and prices are again on the rise.
We are seeing some multiple offers and properties selling for over asking, but we are also seeing some properties selling for less than asking and staying on the market a bit longer, meaning there are still good opportunities available for motivated buyers.
There is a shortage of housing that is driving this market and it is not going away anytime soon.
When looking at a short period of time such as a few months or a year you miss the bigger and much more important picture.
No doubt, it is hard to make a decision to buy a home and really, it is hard to buy a home when you do not have access to the inside information and the knowledge of how real estate works. Lucky for you, we have both!
Looking at the big picture and understanding what the long term goals are will give buyers a better understanding when deciding what to do.
So what to do? Buy or Rent until things change?
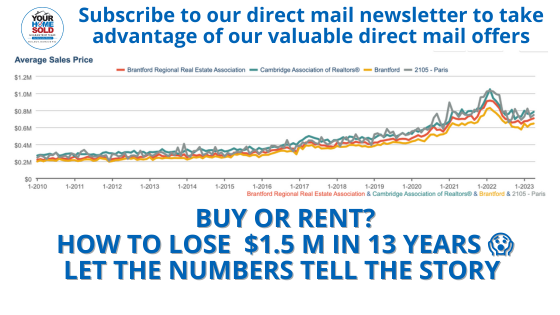
Choose to rent instead of buy could cost you the opportunity to have somewhere around $1.5m in equity in just 13 years.
Average house prices in our area increased by 210% over the past 13 years.
Average price in 2010 was about $233,000
Average price in 2023 was about $720,000
Increase of about $486,000 - in just 13 years.
Using the same % increase of 210%
Average price in 2036 could be about $1.5 million while choosing to rent over the same period will cost you about $391,000! ??
Just for fun 2049 average price could be about $3.15 million. ?? WOW
Yes this is a simplified exercise to demonstrate the benefit of buying instead of renting, we are aware there are other costs and considerations, even with those included, buying is by far better choice over the long term AND there are also tips, tricks and solid advice that could make this scenario even sweeter for you the buyer!
Buying a home may be easier than you think, call or text 226-400-6458 today to learn more!
Our home hunter service give you access to special financing, off market homes not available anywhere else and all VIP Buyers get a free home warranty and a Buyer Satisfaction Guarantee!* Learn more here
Stats are from ITSO MLS as of May 8, 2023
What it looks like when you buy:
Average sale price Jan 2010 VS April 2023
| Area | Jan 2010 | April 2023 | Percent increase | Amount increase | |
| Brant Area | $220,000 | $707,000 | 221% | $487,000 | |
| Cambridge Area | $270,000 | $783,000 | 190% | $513,000 | |
| Brantford | $199,000 | $646,000 | 225% | $447,000 | |
| Paris | $245,000 | $746,000 | 204% | $501,000 |
Estimated vaue in 13 years
| Percent increase | 2023-04-01 | 2036-04-01 | ||
| Brant Area | 221% | $707,000 | $1,565,041 | |
| Cambridge Area | 190% | $783,000 | $1,487,700 | |
| Brantford | 225% | $646,000 | $1,451,065 | |
| Paris | 204% | $746,000 | $1,525,494 |
What it looks like when you rent:
| When you RENT!! | When you OWN!! | ||||||||
| Renting | 2010-01-01 | 160 months | Total Paid out | Apr-23 avg rent | Next 160 months | Total Paid Out (Lost) | Vs | Increase in equity | |
| Brant Area | 860 | 160 | $137,600 | 2300 | 160 | $368,000.00 | $1,565,040.00 | ||
| Cambridge Area | 836 | 160 | $133,760.00 | 2800 | 160 | $448,000.00 | $1,487,700.00 | ||
| Brantford | 860 | 160 | $137,600.00 | 2277 | 160 | $364,320.00 | $1,451,065.33 | ||
| Paris | 860 | 160 | $137,600.00 | 2400 | 160 | $384,000.00 | $1,525,493.88 |
*Conditions apply call/text for details.
We would like to hear from you! If you have any questions, please do not hesitate to contact us. We are always looking forward to hearing from you! We will do our best to reply to you within 24 hours !

